
Industry · · 6 min read
Window-to-wall ratio from a laser scan: measuring a facade instead of estimating it
Energy audits and facade retrofits start from the glazed fraction of each elevation, and it is usually a guess from old drawings. How a scan-derived model turns it into a measurement, with a worked calculation on a real facade.
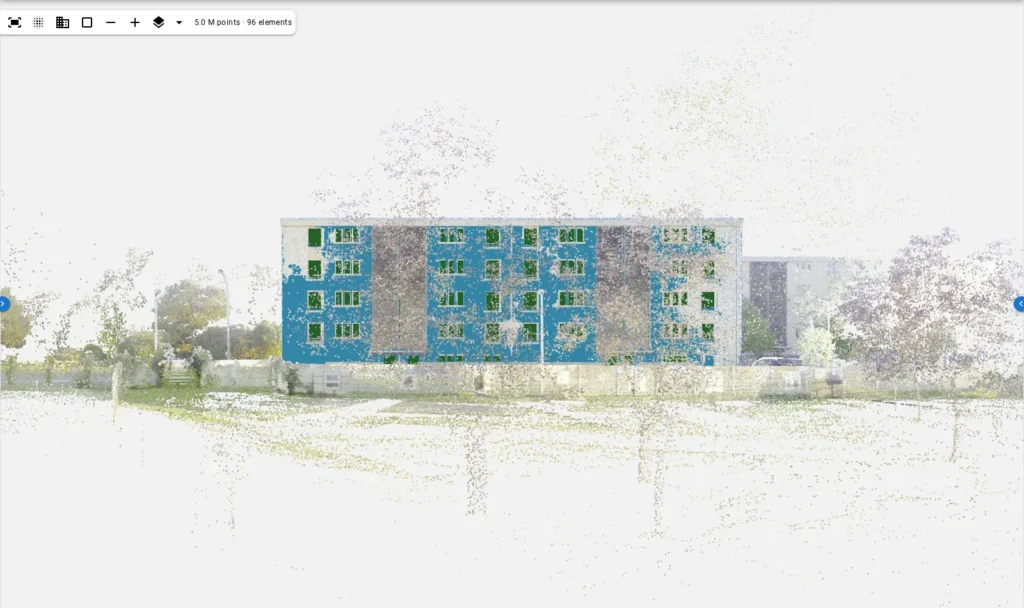
Every energy audit, overcladding study and facade replacement starts from the same quantity: how much of each elevation is glass. It goes into the U-value calculation, the solar gain, the daylight factor and the cost estimate. And on an existing building it is almost always estimated, from drawings that predate the last refurbishment or from a photograph and a scale bar. This article shows how to get it from a scan as a measurement, and works through the calculation on a real facade.
What the ratio is, and the three definitions of it
Window-to-wall ratio (WWR) is the area of the openings divided by the gross area of the facade, both measured in the plane of the facade. Simple, except that “opening” has three readings:
- Rough opening: the hole in the wall, edge to edge. What a modelled window’s box represents, and what a thermal bridge calculation wants.
- Frame outer edge: the window unit. Close to the rough opening, less the tolerance gap; what a replacement quote is priced on.
- Glazing only: the glass, inside the frame. What solar gain and daylight calculations use. Typically 70 to 85 % of the frame area depending on the profile.
Whatever you compute, say which one. The worked example below gives the rough-opening figure, which is what a model of the openings measures directly, and shows how to derive the others.
Why the estimate is usually wrong
Drawings of an existing building show the facade as designed or as last surveyed. Windows have been replaced with different frames, a ground-floor bay has been bricked up, a balcony has been enclosed. A photograph corrects some of that but is a perspective projection: a window at the far end of a 40 m facade is foreshortened and the estimate drifts by several percent. Several percent of WWR is the difference between two U-value bands in a compliance calculation.
A registered laser scan is a measurement of the facade as it stands today, in metres, without perspective. The question is only how to get from points to opening areas.
From scan to opening areas
An automatic pipeline does four things with the scan: it fits the facade plane, measures the facade’s extent within that plane, has a reader propose every opening as a box in the plane, and measures each box against the points themselves. What comes out is the facade’s dimensions and a list of openings, each with a width and a height in metres. That is all WWR needs.
The worked example is the reference building, south facade, from our run of 10 September 2026:
| Quantity | Value | Source |
|---|---|---|
| Facade length (u) | 39.90 m | measured extent; reference walls 39.87 m |
| Facade height (v) | 14.9 m | measured extent |
| Gross facade area | 594 m² | length × height |
| Windows found | 78 | 77 paired with the reference, 1 not |
| Doors found | 3 | reference has 4 |
| Windows in the reference | 96 | surveyor’s model |
Each opening’s area is width × height from its box. Summing the 78 windows and 3 doors of the proposal gives the rough-opening area of the openings the pipeline found. Divide by 594 m² and you have the WWR of the proposal.
The part where the numbers must be read carefully
The proposal found 77 of 96 windows. If you compute WWR from the proposal alone, you undercount the glazed area by roughly the missing 19 windows, which on this facade is about a fifth. That is not a reason to distrust the measurement; it is a reason to do the review before computing the ratio. The review is where the 19 missing windows, which sit behind loggia screens on this building, get drawn by a person with the cloud in front of them. After the review, the reviewed IFC has all 96, and the ratio computed from it is the measured one.
Two more things affect the number and are visible in the per-element record:
- Unfitted openings keep their proposed height, which is its weak axis: on an earlier building 49 % of unfitted heights were more than 10 cm off. On this run 18 of the 83 windows were unfitted. If the ratio matters to a decimal, check those 18 in the review; they are flagged.
- Fitted openings are within about two centimetres on each edge. Over a 1.2 m by 1.4 m window, a 2 cm edge error is about 3 % of its area, and errors on opposite edges cancel on average.
The arithmetic, with the real counts
To make the calculation concrete without publishing every box, take the reviewed model of the example facade with all 96 windows and 4 doors, and the median opening sizes from the run: windows about 1.15 m by 1.35 m on the upper storeys, the ground-floor openings and the two entrance doors larger.
| Line | Value |
|---|---|
| Gross facade area (39.90 m × 14.9 m) | 594 m² |
| 96 windows at a median of about 1.55 m² each (rough opening) | ≈ 149 m² |
| 4 doors at about 2.2 m² each | ≈ 9 m² |
| Opening area, rough | ≈ 158 m² |
| WWR, rough opening | ≈ 27 % |
| Glazing at 0.84 of the rough opening | ≈ 133 m² |
| WWR, glazing | ≈ 22 % |
The ≈ signs are honest: the per-window areas here are a median times a count, to show the scale, and the real calculation sums the 96 individual boxes from the element list. The point of the table is the sensitivity. Computing from the proposal alone, with 77 windows, would have given about 22 % rough instead of 27 %, a difference of five points that would move a U-value calculation across a band. The review is not optional for this use.
Which definition the standards want
Energy standards are specific about the opening they mean, and they do not all agree. ASHRAE 90.1 defines the fenestration area as the rough opening, including the frame. The Passive House method uses the rough opening for the installed U-value and the glazing area for solar gains. National regulations in Europe generally take the frame’s outer dimensions. Before the ratio goes into a calculation, check which one the calculation expects; a modelled opening gives the rough figure, and the frame correction gets you to the others.
Per orientation, per storey
Because every opening has a position in the facade plane, the ratio can be cut any way the energy model wants. Per storey: group openings by their v (storey lines are inferred from the rows of window heads and included in the IFC). Per orientation: each facade is one run with its own plane, so the ratio is per facade by construction; the plane’s normal gives the orientation. Per bay, if a retrofit is phased: filter by u.
All of this is arithmetic on the element list, which the platform exports as JSON alongside the IFC, so the calculation lives in your spreadsheet or your energy tool and not in ours.
From rough opening to glazing
To convert the rough-opening ratio to a glazing ratio, subtract the frame. The scan shows the frame in the scan itself, but this version of the pipeline models the opening, not the frame profile. Use the frame width from a site visit or the window schedule: for a typical 70 mm PVC profile on a 1.2 m by 1.4 m opening, the glazing is about 0.84 of the rough opening. Apply per window type, or globally if the windows are uniform, which on a housing block of this kind they usually are.
What you get that an estimate cannot give
A measured WWR comes with its evidence. For each opening there is a box in metres, a confidence, a record of whether it was measured or kept as drawn, and the evidence it was read from. When the auditor, the client or the building control officer asks where the number came from, the answer is a facade elevation with every opening drawn on it and a scan behind it, not a drawing from 1978 and a photograph. On a retrofit budget that turns on the glazed fraction, that is the difference between a defensible number and an argued one.
The facade dimensions, counts and error figures are from the AutoIFC engine’s run and scoring of 10 September 2026 on the reference building. The frame fraction is a stated assumption. See the Accuracy page for the current table and the Industries page for the facade-engineering use case.
Questions
What is a typical window-to-wall ratio?
For residential facades, 15 to 30 % is common; office curtain walls run 40 to 70 %. Regulations and energy models care about the value per orientation, which is why it should be measured per facade rather than averaged.
Can a laser scan measure the window-to-wall ratio?
Yes, once the openings are modelled: the ratio is the sum of the opening areas over the facade area, both in the facade's plane. The scan gives the geometry; the model gives the count. An automatic pipeline produces both, and a reviewer confirms the openings.
Does WWR include the frame?
Definitions differ. Most energy standards take the rough opening or the frame's outer edge; some take glazing only. A modelled opening gives the rough-opening figure; subtract the frame width for glazing-only.